What is ChartGPT?
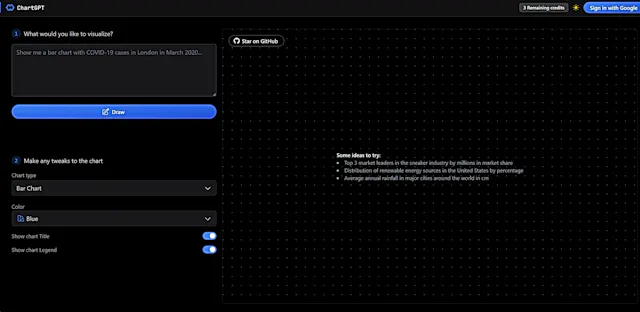
ChartGPT is an AI-powered tool that transforms text descriptions into visually appealing charts and graphs. It leverages natural language processing to interpret user inputs and generate data visualizations instantly, making data representation more accessible and efficient.
Top Features:
- Natural Language Input: users can describe their desired chart in plain English for quick creation.
- Diverse Chart Types: supports various chart formats including bar, line, pie, and scatter plots.
- Customization Options: allows users to adjust colors, labels, and other visual elements easily.
Pros and Cons
Pros:
- User-Friendly Interface: intuitive design makes it easy for anyone to create professional-looking charts.
- Time-Saving: rapidly generates charts, reducing the time spent on manual data visualization.
- No Coding Required: eliminates the need for programming skills to create complex visualizations.
Cons:
- Limited Data Import: lacks direct integration with external data sources for more complex datasets.
- Accuracy Dependence: chart quality relies heavily on the clarity of user input.
- Basic Customization: advanced users might find the customization options somewhat limited.
Use Cases:
- Business Presentations: quickly create visuals for meetings and reports to illustrate key points.
- Academic Research: students and researchers can visualize data for papers and presentations.
- Data Journalism: journalists can rapidly produce charts to support their articles and stories.
Who Can Use ChartGPT?
- Business Professionals: managers and executives needing quick data visualizations for decision-making.
- Students and Educators: for creating visual aids in academic work and teaching materials.
- Content Creators: bloggers and social media managers looking to enhance their content with visuals.
Pricing:
- Free Trial: available for users to test the platform's capabilities.
- Pricing Plan: not publicly disclosed, likely based on usage or subscription model.
Our Review Rating Score:
- Functionality and Features: 4/5
- User Experience (UX): 4.5/5
- Performance and Reliability: 4/5
- Scalability and Integration: 3.5/5
- Security and Privacy: 4/5
- Cost-Effectiveness and Pricing Structure: 3.5/5
- Customer Support and Community: 3.5/5
- Innovation and Future Proofing: 4/5
- Data Management and Portability: 3.5/5
- Customization and Flexibility: 3.5/5
- Overall Rating: 4/5
Final Verdict:
ChartGPT simplifies data visualization with its AI-driven approach. While it excels in user-friendliness and speed, there's room for improvement in advanced features and data integration. It's a valuable tool for quick, professional-looking charts, especially for non-technical users.
FAQs:
1) How accurate are the charts generated by ChartGPT?
The accuracy of ChartGPT-generated charts depends on the clarity and precision of the user's input. While the AI interprets natural language well, it's crucial to provide clear, accurate data for the best results.
2) Can ChartGPT integrate with other data visualization tools?
Currently, ChartGPT operates as a standalone tool. It doesn't offer direct integration with other data visualization platforms, but charts can be exported for use in various applications.
3) Is ChartGPT suitable for complex data analysis?
ChartGPT is primarily designed for quick, straightforward visualizations. For complex data analysis requiring advanced statistical methods, specialized tools might be more appropriate.
4) How does ChartGPT compare to traditional charting software?
ChartGPT stands out with its natural language input and speed, making it more accessible than traditional software. However, it may lack some advanced features found in specialized charting tools.
5) Can I use ChartGPT for real-time data visualization?
ChartGPT is not designed for real-time data visualization. It's best suited for creating static charts based on user-provided data rather than dynamic, live-updating visualizations.