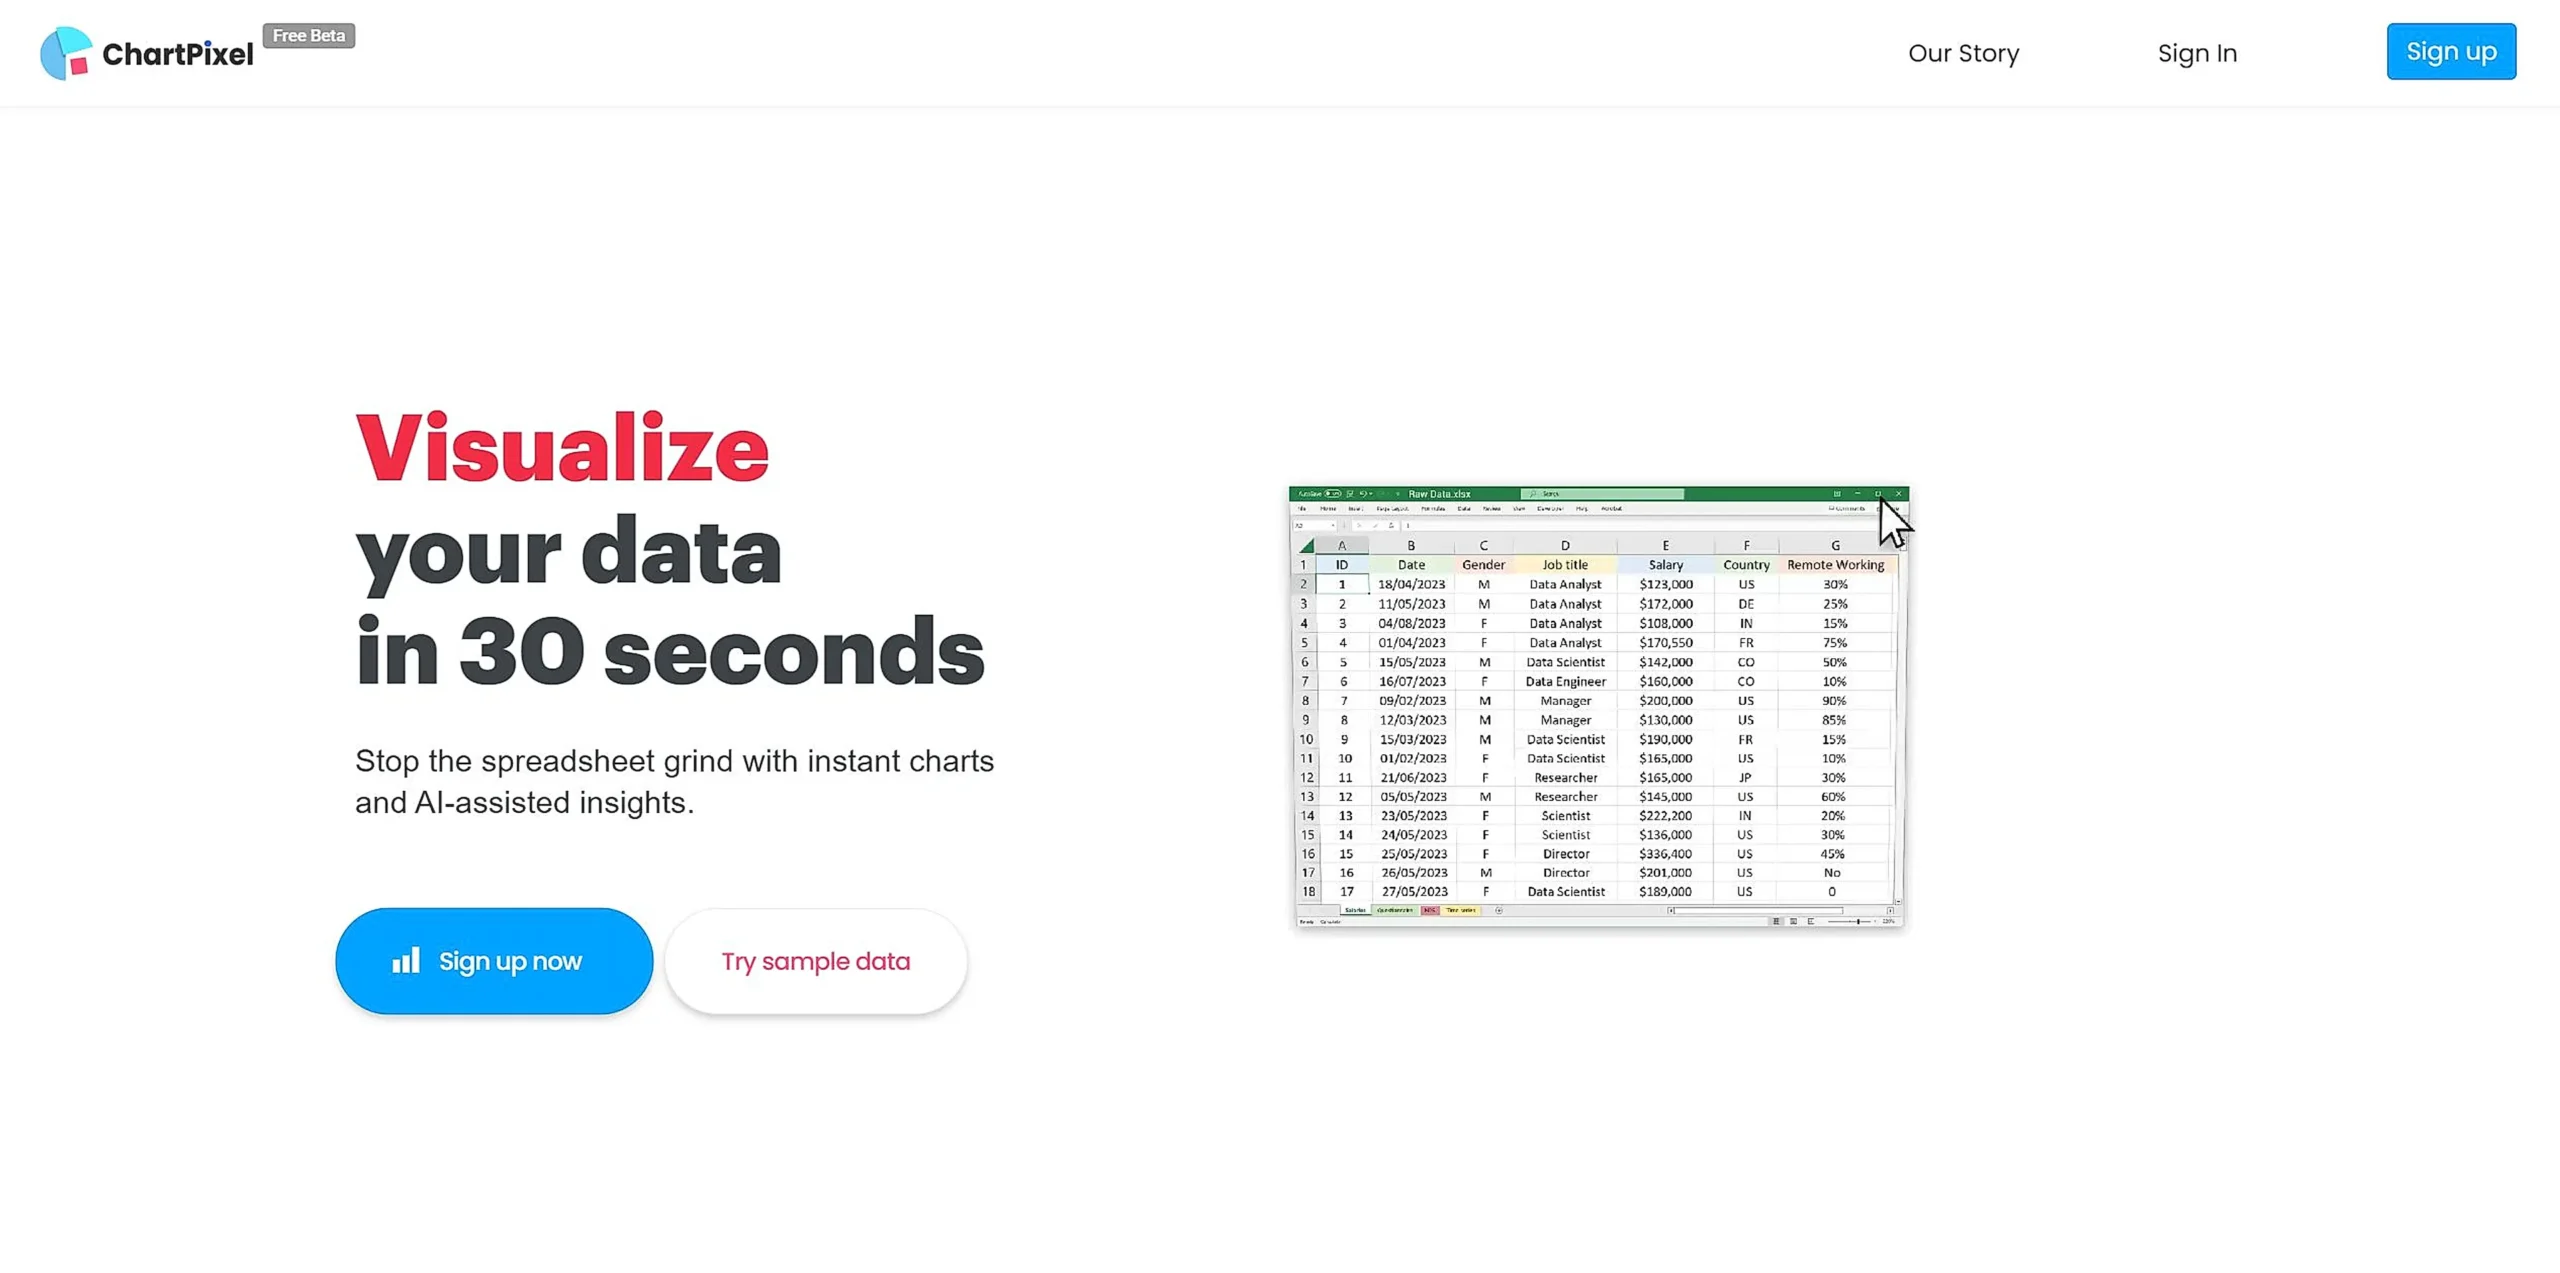
What is ChartPixel?
ChartPixel is an AI-powered data visualization tool that transforms complex data into clear, understandable charts in 30 seconds. The platform combines artificial intelligence with data analysis to help users create insightful visualizations without requiring technical expertise.
Top Features:
- AI-Assisted Analytics: automatically selects relevant columns and generates statistical insights from your data.
- Automated Data Cleaning: identifies and fixes inconsistencies in datasets for accurate analysis.
- One-Click Export: converts charts and insights directly into PowerPoint presentations.
Pros and Cons
Pros:
- Time Efficiency: reduces hours of manual data analysis to just 30 seconds.
- User-Friendly Interface: intuitive design makes data analysis accessible to beginners.
- No Technical Skills Required: eliminates the need for coding or advanced statistical knowledge.
Cons:
- Beta Limitations: some features may be unstable or incomplete during the beta phase.
- AI Dependency: generated insights might not always match specific analytical requirements.
- Advanced Feature Learning: mastering complex functionalities requires additional time investment.
Use Cases:
- Market Research: analyzing survey data and creating presentation-ready market insights.
- Academic Research: visualizing research data and generating statistical analysis.
- Business Analytics: creating data-driven reports and presentations for stakeholders.
Who Can Use ChartPixel?
- Researchers: academics and professionals needing quick data visualization and analysis.
- Business Professionals: managers and analysts requiring data-driven presentations.
- Students: learners working on data-heavy projects and academic assignments.
Pricing:
- Free Beta: currently available at no cost during the beta phase[2][4].
- Future Plans: premium features and subscription options to be announced.
Our Review Rating Score:
- Functionality and Features: 4.4/5
- User Experience (UX): 4.8/5
- Performance and Reliability: 4.6/5
- Scalability and Integration: 4.2/5
- Security and Privacy: 4.5/5
- Cost-Effectiveness: 4.7/5
- Customer Support: 4.3/5
- Innovation: 4.6/5
- Data Management: 4.4/5
- Customization: 4.3/5
- Overall Rating: 4.5/5
Final Verdict:
ChartPixel stands out as a powerful tool for quick data visualization and analysis. Its AI capabilities and user-friendly interface make it valuable for both beginners and professionals, despite some beta-phase limitations.
FAQs:
1) How secure is my data on ChartPixel?
ChartPixel prioritizes data protection and never submits raw data to large language models. All analysis is performed within secure parameters.
2) Can I collaborate with team members on ChartPixel?
Yes, ChartPixel allows sharing and collaboration through project links, enabling team members to work together on analyses.
3) What file formats does ChartPixel support?
ChartPixel supports Excel and CSV files, plus the ability to import data directly from web tables.
4) How long does it take to learn ChartPixel?
Basic features can be mastered in minutes, though advanced functionalities may require additional learning time.
5) Does ChartPixel work on mobile devices?
Yes, ChartPixel is accessible through mobile browsers, though desktop usage provides the optimal experience.