Flourish
What is Flourish?
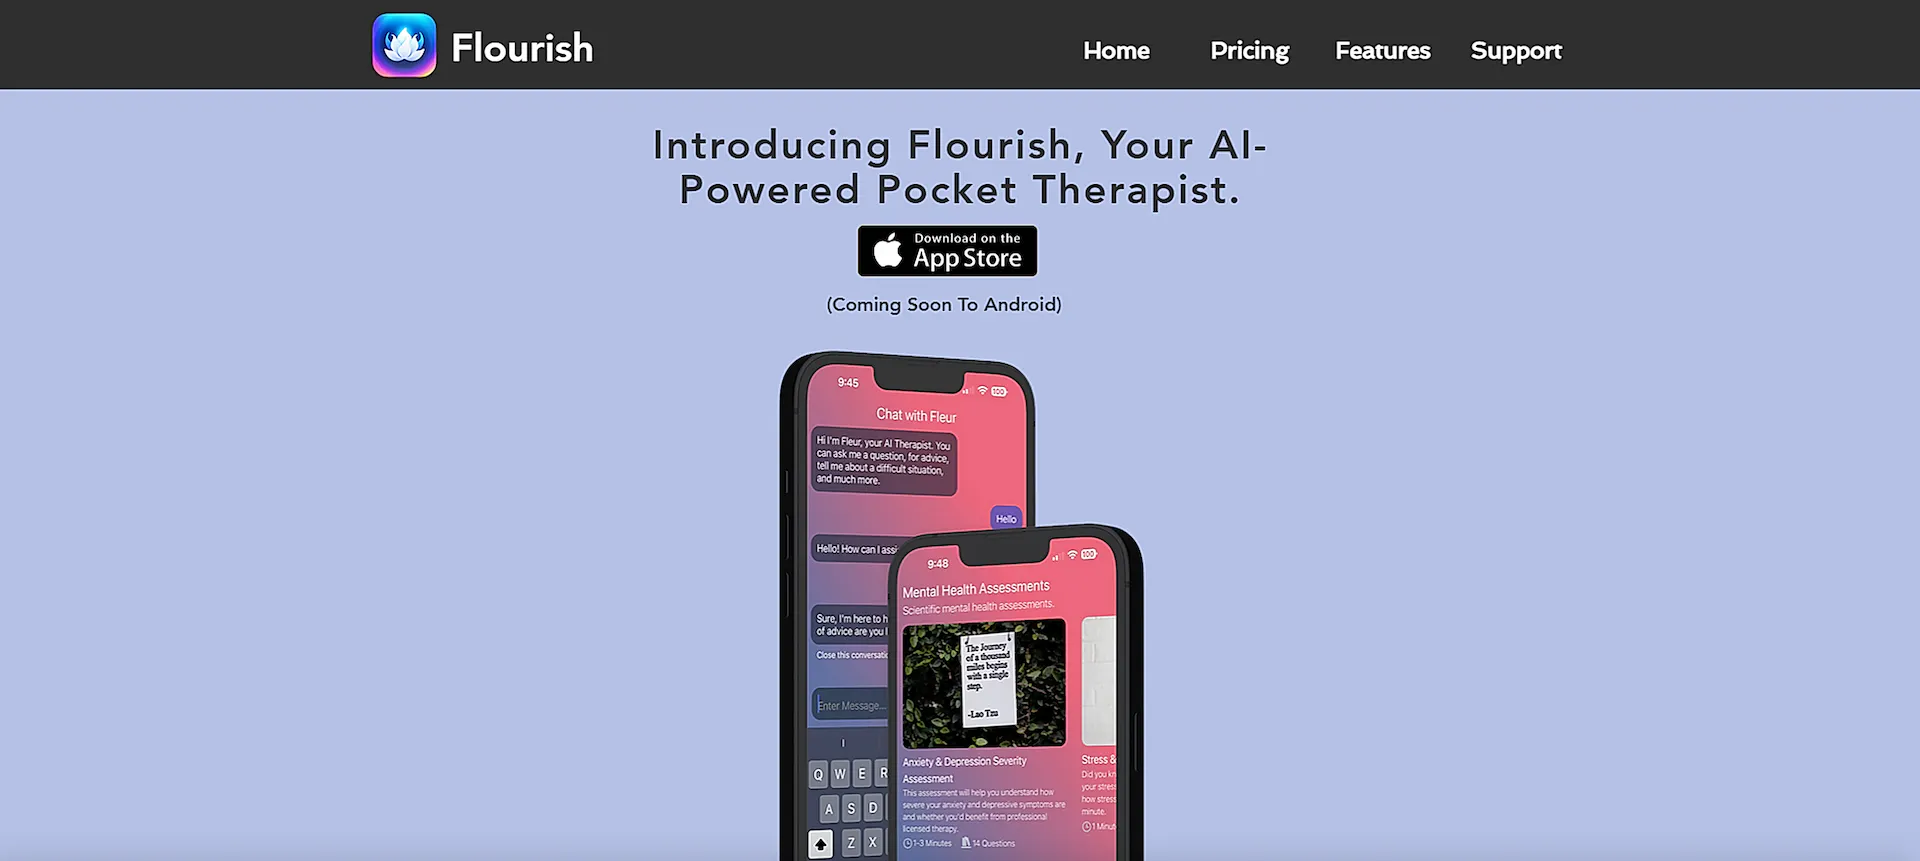
Flourish is an AI-powered mental wellness companion created by Stanford-trained psychologists. It combines psychological principles with artificial intelligence to provide personalized mental health support, stress management tools, and daily well-being activities.
Top Features:
- AI Companion: interact with Fleur, an emotionally intelligent AI that provides mental health guidance.
- Mental Health Assessment: receive detailed evaluations to understand your psychological needs and progress.
- Mood Tracking: document and analyze your emotional patterns through an intuitive interface.
Pros and Cons
Pros:
- User Interface: clean and intuitive design makes daily mental health tracking simple.
- Privacy: maintains high standards of data protection for sensitive mental health information.
- Personalization: adapts support based on individual user needs and progress.
Cons:
- Limited Customization: preset activities may not fit all specific mental health needs.
- AI Limitations: cannot replace professional mental health care for serious conditions.
- Internet Dependency: requires constant internet connection for AI features to work.
Use Cases:
- Daily Check-ins: regular emotional health monitoring and self-reflection exercises.
- Stress Management: guided breathing and meditation sessions during anxious moments.
- Personal Growth: structured activities for developing emotional intelligence and resilience.
Who Can Use Flourish?
- Busy professionals: individuals seeking quick mental wellness support during work hours.
- Students: young adults managing academic stress and emotional challenges.
- Self-improvement enthusiasts: people committed to personal growth and emotional development.
Pricing:
- Free Version: basic features including mood tracking and limited AI interactions.
- Premium Plan: full access to AI companion and advanced mental wellness tools.
Our Review Rating Score:
- Functionality and Features: 4.5/5
- User Experience (UX): 4.8/5
- Performance and Reliability: 4.3/5
- Scalability and Integration: 4.0/5
- Security and Privacy: 4.7/5
- Cost-Effectiveness: 4.2/5
- Customer Support: 4.4/5
- Innovation: 4.6/5
- Data Management: 4.3/5
- Customization: 3.9/5
- Overall Rating: 4.4/5
Final Verdict:
Flourish stands out as a reliable mental wellness companion, blending AI technology with psychological expertise. While it excels in daily support and user experience, it works best as a supplement to professional mental health care.
FAQs:
1) Is Flourish a replacement for therapy?
No, Flourish is a supplementary tool for mental wellness but should not replace professional mental health treatment.
2) How does Flourish protect user privacy?
Flourish implements advanced encryption and strict data protection protocols to secure all personal information.
3) Can I use Flourish offline?
Basic features work offline, but AI interactions require an internet connection.
4) How often should I use Flourish?
Daily use is recommended for optimal results, but you can adjust frequency based on your needs.
5) Does Flourish integrate with other health apps?
Currently, Flourish operates as a standalone app with limited third-party integrations.
Stay Ahead of the AI Curve
Join 76,000 subscribers mastering AI tools. Don’t miss out!
- Bookmark your favorite AI tools and keep track of top AI tools.
- Unblock premium AI tips and get AI Mastery's secrects for free.
- Receive a weekly AI newsletter with news, trending tools, and tutorials.


